
1. What is machine learning and how does it work?
Answer: Machine learning is a branch of computer science that focuses on making machines smart. When a machine can make its own decisions, it is referred to as intelligent.
Machine learning is accomplished by feeding training data to a machine learning algorithm. A trained ML model is the result of this learning process. This model artifact makes predictions based on new data with unknown outcomes.
Let’s look at an example of machine learning in action:
Automobiles that drive themselves
radar1
Self-driving automobiles are an example of machine learning in action. Self-driving automobiles are possible thanks to machine learning. What role does machine learning play in self-driving cars?
As a result, data from all self-driving cars on the road is collected via sensors.
2. What are the steps involved in the development of a Machine Learning system?
Designing a machine learning system
A) Gather Requirements: The system designer collects information regarding the system’s design, such as the size of datasets that will be used. Is it necessary for the system to be more precise or faster? What kind of hardware is required for the model? Is it possible that the model needs to be retrained?
B) Identify the Metrics: Metrics are used to assess the model’s performance. Click-through rate, time spent watching the video, and other functional indicators are used to determine how helpful the model will be.
Scalability, adaptability, and simplicity of training are examples of non-functional measures. The dataset is divided into three sets while the model is being developed: training, testing, and validation.
3. What are the different types of Machine Learning Algorithms?
These are categorized as follows:
Supervised Learning Algorithm: Supervised learning predicts outcomes using labeled data. Learning takes place in the presence of a supervisor, exactly as it would for a tiny child with the assistance of his instructor. The machines may test their accuracy and learn on their own by using labeled data.
Unsupervised Learning Algorithms: Unsupervised learning occurs when no supervisor is present. The unlabeled data was clustered using machine learning algorithms. These algorithms detect hidden patterns in data without the assistance of humans.
Reinforcement Learning: The algorithm learns from prior experiences and feedback mechanisms. This sort of learning incorporates earlier input.
4. What are some of the uses of machine learning?
Here are a few of the most popular applications:
machine-learning applications
The majority of websites now have a virtual customer support assistant that provides automated responses to your questions based on the information on the website. Chatbots can learn from their inputs and offer better answers over time with the help of machine learning algorithms.
Results from Web Search Engines: When we use a Web Search Engine, such as Google, it returns certain results. Google can determine whether or not the query results are appropriate by clicking on any of the presented results and spending some time on the webpage. At the backend, machine learning algorithms are used.
5. What are the approaches for classification and regression
The following are the classification algorithms:
Classification Using a Decision Tree
Nearest Neighbors (K)
Bayes, Nave
Machine to Support Vectors
Forest of Chance
Descent of a Stochastic Gradient
The following are some examples of regression methods:
Regression Linear
Regression using Support Vectors
Tree of Regression
6. Can you give an example of machine learning classification and regression?
To further understand categorization and regression, consider the following example.
Because speed is a continuous variable, how can we know what the car’s speed is? – It’s a Regression Issue.
If we know the car’s speed, can we anticipate whether the car is traveling at a high or low speed? – It’s difficult to categorize.
7. What is the best way to create a machine learning model?
The ML model is typically developed in three steps:
Select a model’s algorithm and train it.
Using test data, you may put the model to the test.
If there are any changes, retrain the model and use it for real-time tasks.
8. What are the most widely used machine learning algorithms?
The following are the most frequent algorithms:
The K-Nearest Neighbour algorithm is a supervised technique that is used to solve classification and regression problems. Similar points are assumed to be close together in this method. The query is created by selecting an acceptable number of samples (k). The object in inquiry is referred to as the inquiry. For example, the system suggests 5 songs that are related. So, here’s k: 5.
The decision tree is a supervised learning technique that is commonly used to solve classification problems. The decision tree is organized like a tree, with nodes representing the dataset, branches representing data rules, and leaves representing the outcome.
Algorithms for Neural Networks: The artificial neural network learns by a combination of methods.
9. What is Logistic Regression?
Answer: Logistic Regression is an algorithm that comes under classification type. It predicts a binary outcome that is either 0 or 1 for given input variables.
The output of Logistic Regression is 0/1. The threshold value is generally taken as 0.5. By threshold value, we mean any input below 0.5 has output 0, and any value more than the threshold has output 1.
10. What is Lazy Learning?
Lazy Learning is a machine learning method where the data is not generalized until the query is made to it. In other words, such learning defers the processing until the request for information is received. An example of a Lazy learning technique is KNN, where the data is just stored. It is processed only when the query is made to it.
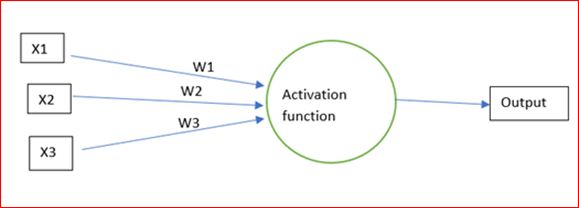
11. What is a Perceptron? How does it work?
A Perceptron is the simplest ML algorithm for linear classification. A single-layer neural network is called a Perceptron. A perceptron model consists of the input layer, hidden layer, and output layer.
The input layer is connected to the hidden layer through weights and the weights are +1,0 or -1. The activation function for a single layer model is a binary step function.
The perceptron learning model is a binary classifier that classifies the inputs to output classes. The net input is fed to the activation function. If the output of the activation function is greater than the threshold value, it will return 1 otherwise, if the output is less than the threshold value, it will return 0.
The output for the below model will be
O= w1 * x1 + w2 * x2 + w3 *x3
12) What is the cost of bias versus variance?
Bias and variance are both mistakes. Bias is an inaccuracy in the learning algorithm caused by erroneous or excessively simplified assumptions. It may cause the model to under-fit the data, making it difficult to achieve high predicted accuracy and generalize knowledge from the training to the test sets.
Variance is an error caused by a learning method with too much complexity. As a result, the technique is extremely sensitive to large amounts of variation in the training data, which can cause the model to overfit the data.
To limit the number of errors as much as possible, we’ll have to trade off bias and variance.
13. What is Overfitting and How Can It Be Avoided?
When a model learns the training set too well, it interprets random oscillations in the data as concepts, which is known as overfitting. These have an impact on the model’s generalization capabilities and do not apply to new data.
When a model is given the training data, it achieves 100% accuracy, which is technically a loss. However, there may be inaccuracy and low efficiency if we use the test data. Overfitting is the term for this condition.
Overfitting can be avoided in a variety of methods, including:
Regularization. It includes a cost word for the aspects of the objective function.
Making a basic model The variance can be decreased by using fewer variables and parameters.
14. What is semi-supervised machine learning, and how does it work?
Unsupervised learning uses no training data while supervised learning uses fully labeled data.
In semi-supervised learning, there is a small amount of labeled data and a big amount of unlabeled data in the training data.
Semi-supervised Learnin12. What is Semi-supervised Machine Learning, and how does it work?
Unsupervised learning uses no training data while supervised learning uses fully labeled data.
In semi-supervised learning, there is a small amount of labeled data and a big amount of unlabeled data in the training data.
Learning that is semi-supervised
15) What exactly do you mean when you say ensemble learning?
Ensemble learning is the process of creating and combining several models, such as classifiers, to solve a certain computer problem. Committee-based learning or learning multiple classifier systems are other names for ensemble methods. It teaches different hypotheses to solve the same problem. Random forest trees are a good example of ensemble modeling since they use numerous decision trees to forecast outcomes. It is used to improve the categorization, approximation of functions, prediction, and other aspects of a model.
16) In Machine Learning, what is a model selection?
Model selection is the process of selecting models from a variety of mathematical models that are used to define the same facts. It is used to apply model learning.
17) In machine learning, what are the three steps of developing hypotheses or models?
In machine learning, there are three stages of building hypotheses or models:
Construction of a model
It selects an appropriate method for the model and trains it to meet the problem’s requirements.
Putting the model into practice
It’s in charge of double-checking the model’s accuracy using test data.
Validation of models
After testing, it makes the necessary changes and applies the final model.
18) What is the conventional strategy for supervised learning, in your opinion?
The conventional strategy in supervised learning is to divide the set of examples into the training set and the test set.
19) What are the advantages and disadvantages of supervised learning?
- Classification
- Recognized Speech
- Regression
- Time Series Prediction
- Strings with annotations
20) What are the advantages and disadvantages of unsupervised learning?
Identifying data clusters
Finding low-dimensional data representations
Identifying interesting trends in data
Finding new observations/cleaning up the database
Identifying intriguing coordinates and relationships
21. Which do you think is more important: model correctness of model performance?
Model performance is a subset of model correctness. The model’s performance is directly related to its accuracy. As a result, the more accurate the predictions are, the better the model’s performance.
22) What is the difference between bagging and boosting?
Bagging is a technique for enhancing unstable estimates or classification algorithms in ensemble learning.
To lower the bias of the combined model, boost approaches are applied consecutively.
23) In Machine Learning, what are the similarities and differences between bagging and boosting?
- Bagging and Boosting have certain similarities.
- Both are ensemble approaches for obtaining N learns from a single learner.
- Both use random sampling to generate several training data sets.
24) Which are the two components of the Bayesian logic program?
A Bayesian logic program consists of two components:
- Logical
It contains a set of Bayesian Clauses, which capture the qualitative structure of the domain. - Quantitative
It is used to encode quantitative information about the domain.
25) Describe dimension reduction in machine learning.
Dimension reduction is the process that is used to reduce the number of random variables under consideration.
Dimension reduction can be divided into feature selection and extraction.
26) Why instance-based learning algorithm sometimes referred to as a Lazy learning algorithm?
In machine learning, lazy learning can be described as a method where induction and generalization processes are delayed until classification is performed. Because of the same property, an instance-based learning algorithm is sometimes called a lazy learning algorithm.
27) What do you understand by the F1 score?
The F1 score represents the measurement of a model’s performance. It is referred to as a weighted average of the precision and recall of a model. The results tending to 1 are considered the best, and those tending to 0 are the worst. It could be used in classification tests, where true negatives don’t matter much.
28) What is Regularization? What kind of problems does regularization solve?
A regularization is a form of regression, which constrains/ regularizes, or shrinks the coefficient estimates towards zero. In other words, it discourages learning a more complex or flexible model to avoid the risk of overfitting. It reduces the variance of the model, without a substantial increase in its bias.
Regularization is used to address overfitting problems as it penalizes the loss function by adding a multiple of an L1 (LASSO) or an L2 (Ridge) norm of weights vector w.
29) Why do we need to convert categorical variables into factors? Which functions are used to perform the conversion?
Most Machine learning algorithms require numbers as input. That is why we convert categorical values into factors to get numerical values. We also don’t have to deal with dummy variables.
The functions factor() and as.factor() are used to convert variables into factors.
30) Do you think that treating a categorical variable as a continuous variable would result in a better predictive model?
For a better predictive model, the categorical variable can be considered as a continuous variable only when the variable is ordinal.
31) What do you mean by Associative Rule Mining (ARM)?
Associative Rule Mining is one of the techniques to discover patterns in data like features (dimensions) which occur together and features (dimensions) that are correlated. It is mostly used in Market-based Analysis to find how frequently an item set occurs in a transaction. Association rules have to satisfy minimum support and minimum confidence at the very same time. Association rule generation is generally comprised of two different steps:
- “A min support threshold is given to obtain all frequent item-sets in a database.”
- “A min confidence constraint is given to these frequent item-sets to form the association rules.”
Support is a measure of how often the “item set” appears in the data set and Confidence is a measure of how often a particular rule is true.
32). What is Marginalisation? Explain the process.
Marginalization is summing the probability of a random variable X given the joint probability distribution of X with other variables. It is an application of the law of total probability.
P(X=x) = ∑YP(X=x,Y)
Given the joint probability P(X=x, Y), we can use marginalization to find P(X=x). So, it is to find the distribution of one random variable by exhausting cases on other random variables.
33). Explain the phrase “Curse of Dimensionality”.
The Curse of Dimensionality refers to the situation when your data has too many features.
The phrase is used to express the difficulty of using brute force or grid search to optimize a function with too many inputs.
It can also refer to several other issues like:
- If we have more features than observations, we have a risk of overfitting the model.
- When we have too many features, observations become harder to cluster. Too many dimensions cause every observation in the dataset to appear equidistant from all others and no meaningful clusters can be formed.
Dimensionality reduction techniques like PCA come to the rescue in such cases.
34. What is the Principle Component Analysis?
The idea here is to reduce the dimensionality of the data set by reducing the number of variables that are correlated with each other. Although the variation needs to be retained to the maximum extent.
The variables are transformed into a new set of variables that are known as Principal Components’. These PCs are the eigenvectors of a covariance matrix and therefore are orthogonal.
35. Differentiate between regression and classification.
Regression and classification are categorized under the same umbrella of supervised machine learning. The main difference between them is that the output variable in the regression is numerical (or continuous) while that for classification is categorical (or discrete).
Example: To predict the definite Temperature of a place is a Regression problem whereas predicting whether the day will be Sunny cloudy or there will be rain is a case of classification.
36. What is target imbalance? How do we fix it? A scenario where you have performed target imbalance on data. Which metrics and algorithms do you find suitable to input this data onto?
If you have categorical variables as the target when you cluster them together or perform a frequency count on them if certain categories are more in number as compared to others by a very significant number. This is known as the target imbalance.
Example: Target column – 0,0,0,1,0,2,0,0,1,1 [0s: 60%, 1: 30%, 2:10%] 0 are in majority. To fix this, we can perform up-sampling or down-sampling. Before fixing this problem let’s assume that the performance metrics used were confusion metrics. After fixing this problem we can shift the metric system to AUC: ROC. Since we added/deleted data [up sampling or downsampling], we can go ahead with a stricter algorithm like SVM, Gradient boosting or ADA boosting.
37. List all assumptions for data to be met before starting with linear regression.
Before starting linear regression, the assumptions to be met are as follows:
- Linear relationship
- Multivariate normality
- No or little multicollinearity
- No auto-correlation
- Homoscedasticity
38. When does the linear regression line stop rotating or find an optimal spot where it is fitted on data?
A place where the highest RSquared value is found in the place where the line comes to rest. RSquared represents the amount of variance captured by the virtual linear regression line concerning the total variance captured by the dataset.
39. Why is logistic regression a type of classification technique and not a regression? Name the function it is derived from?
Since the target column is categorical, it uses linear regression to create an odd function that is wrapped with a log function to use regression as a classifier. Hence, it is a type of classification technique and not a regression. It is derived from the cost function.
40. What could be the issue when the beta value for a certain variable varies way too much in each subset when regression is run on different subsets of the given dataset?
Variations in the beta values in every subset imply that the dataset is heterogeneous. To overcome this problem, we can use a different model for each of the clustered subsets of the dataset or use a non-parametric model such as decision trees.
41. What does the term Variance Inflation Factor mean?
Variation Inflation Factor (VIF) is the ratio of the variance of the model to the variance of the model with only one independent variable. VIP gives the estimate of the volume of multicollinearity in a set of many regression variables.
VIF = Variance of the model with one independent variable
42. Which machine learning algorithm is known as the lazy learner and why is it called so?
KNN is a Machine Learning algorithm known as a lazy learner. K-NN is a lazy learner because it doesn’t learn any machine-learned values or variables from the training data but dynamically calculates distance every time it wants to classify, hence memorizing the training dataset instead.
43. What is Bayes’ Theorem? State at least 1 use case concerning the machine learning context?
Bayes’ Theorem describes the probability of an event, based on prior knowledge of conditions that might be related to the event. For example, if cancer is related to age, then, using Bayes’ theorem, a person’s age can be used to more accurately assess the probability that they have cancer than can be done without the knowledge of the person’s age.
The chain rule for Bayesian probability can be used to predict the likelihood of the next word in the sentence.

44. What are Naive Bayes? Why is it Naive?
Naive Bayes classifiers are a series of classification algorithms that are based on the Bayes theorem. This family of algorithms shares a common principle that treats every pair of features independently while being classified.
Naive Bayes is considered Naive because the attributes in it (for the class) are independent of others in the same class. This lack of dependence between two attributes of the same class creates the quality of naiveness.
45. How would you handle an imbalanced dataset?
Sampling Techniques can help with an imbalanced dataset. There are two ways to perform sampling, Under Sample or Over Sampling.
In Under Sampling, we reduce the size of the majority class to match the minority class thus helping by improving performance w.r.t storage and run-time execution, but it potentially discards useful information.
For Over Sampling, we upsample the Minority class and thus solve the problem of information loss, however, we get into the trouble of having Overfitting.
There are other techniques as well –
Cluster-Based Over Sampling – In this case, the K-means clustering algorithm is independently applied to minority and majority class instances. This is to identify clusters in the dataset. Subsequently, each cluster is oversampled such that all clusters of the same class have an equal number of instances and all classes have the same size
Synthetic Minority Over-sampling Technique (SMOTE) – A subset of data is taken from the minority class as an example and then new synthetic similar instances are created which are then added to the original dataset. This technique is good for Numerical data points.
46. What is the significance of Gamma and Regularization in SVM?
The gamma defines influence. Low values mean ‘far’ and high values mean ‘close’. If gamma is too large, the radius of the area of influence of the support vectors only includes the support vector itself and no amount of regularization with C will be able to prevent overfitting. If gamma is very small, the model is too constrained and cannot capture the complexity of the data.
The regularization parameter (lambda) serves as a degree of importance that is given to miss-classifications. This can be used to draw the tradeoff with OverFitting.
47. Define ROC curve work
The graphical representation of the contrast between true positive rates and the false positive rate at various thresholds is known as the ROC curve. It is used as a proxy for the trade-off between true positives the false positives.
48. What is the difference between a generative and discriminative model?
A generative model learns the different categories of data. On the other hand, a discriminative model will only learn the distinctions between different categories of data. Discriminative models perform much better than generative models when it comes to classification tasks.
49. What are the mesh grid () method and the contour () method? State some uses of both.
The mesh grid( ) function in NumPy takes two arguments as input: range of x-values in the grid, and range of y-values in the grid whereas the mesh grid needs to be built before the contour( ) function in matplotlib is used which takes in many inputs: x-values, y-values, fitting curve (contour line) to be plotted in the grid, colors, etc.
50. Write a simple code to binarize data.
Conversion of data into binary values based on a certain threshold is known as binarizing of data. Values below the threshold are set to 0 and those above the threshold are set to 1 which is useful for feature engineering.
Code:
from sklearn.preprocessing import Binarizer
import pandas
import numpy
names_list = [‘Alaska’, ‘Pratyush’, ‘Pierce’, ‘Sandra’, ‘Soundarya’, ‘Meredith’, ‘Richard’, ‘Jackson’, ‘Tom’,’Joe’]
data_frame = pandas.read_csv(url, names=names_list)
array = dataframe.values
# Splitting the array into input and output
A = array [: 0:7]
B = array [:7]
binarizer = Binarizer(threshold=0.0). fit(X)
binaryA = binarizer.transform(A)
numpy.set_printoptions(precision=5)
print (binaryA [0:7:])
The mesh grid () function is used to create a grid using 1-D arrays of x-axis inputs and y-axis inputs to represent the matrix indexing. Contour () is used to draw filled contours using the given x-axis inputs, y-axis inputs, contour line, colors, etc.