
1. Why is it necessary to visualize data that has been analyzed?
It becomes clear that the human brain can easily understand visual stimuli. Translating the analyzed data into a visual context aids in the better absorption of new insights.
2. Tell me about Tableau’s four top features.
Tableau’s four best features are as follows:
Tableau provides data analysis in real-time.
It allows for complex visualizations (different types of graphs and charts).
Tableau makes it possible to collaborate on data.
Tableau also has a feature that allows you to combine data.
3. What are the different types of measures in Tableau?
Measures refer to data that may be measured or measurable. This is a set of numerical metrics that are kept in tables. Foreign keys are used to refer to their interconnected dimension tables uniquely. An employee table, for example, will have an employee ID, customer key, projects delivered, and so on, all of which are associated with a single project or event.
4. What do Dimensions in Tableau mean? What are the various dimensions of a web application project?
For a certain project or product, we can represent the dimensions of the numerous traits, values, and attributes descriptively. A web app project’s numerous dimensions include the project name, project type, budget, size, number of developers required, delivery date, and so on.
5. What is the difference between discrete and continuous data in Tableau?
Tableau can help you visualize data in two different ways. There are two types of data: discrete and continuous. Discrete types of data refer to data that is separated, unique, and distinct. Continuous data is defined as data that form a continuous whole with continual variation and no interruption.
6.. What is the main difference between Tableau’s continuous and discrete data?
When dealing with discrete data versus continuous data, one key difference that benefits data analysts and BI analysts is that data analysts can sort discrete fields but cannot sort continuous data fields.
7. What are the various Tableau products available?
Tableau offers a diverse range of services. Tableau has several products available.
Tableau Desktop Tableau Server
Tableau Reader; Tableau Online; Tableau Public; Tableau Public; Tableau Public; Tableau Public; Tableau Public In Tableau.
8. what is the difference between discrete and continuous data?
Tableau can help you visualize data in two different ways. There are two types of data: discrete and continuous. Discrete types of data refer to data that is separated, unique, and distinct. Continuous data is defined as data that form a continuous whole with continual variation and no interruption.
9. What is the main difference between Tableau’s continuous and discrete data?
When dealing with discrete data versus continuous data, there is a substantial distinction that benefits data analysts and BI analysts.
10. In Tableau, what are the two different ways of sorting data?
We can use both manual and computational sorting to sort Tableau data. Manual sorting involves dragging the dimension field order and rearrangement on the fly. We use the sort button on an axis to sort the data in calculated sorting.
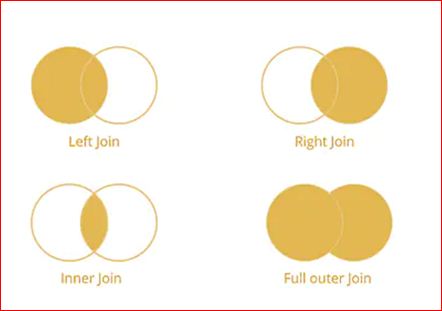
11. What are the various joins available in Tableau?
Tableau joins are identical to SQL joins. These are the following:
- Joining from the left
- Joining the dots correctly
- The inner connection
a complete outer join interview questions for tableau developers
12. Describe a few key approaches to improve Tableau’s performance.
Tableau’s performance can be improved in a variety of ways. The following are some well-known techniques:
We can reduce the amount of data we have and maintain only the information we need for our visualization. It will gradually reduce the volume of data, allowing Tableau to handle it more quickly.
We may use the Extract to make our
Tableau workbook run faster.
When working with numbers, we should avoid utilizing strings and instead use Boolean and integer values. This is because they are faster than strings.
We can conceal fields that aren’t in use.
We can also get rid of extra pages and calculations.
By reducing the number of markers in the view, you can avoid information overload.
13. What are Tableau’s Bins?
Bins are equal-sized containers in Tableau that are used to store data values that match the bin size. They aid in the systematic placement of the measure’s value into bins. For instance, suppose you have a Tableau measure with staff ages ranging from 17 to 65. You must bin the age data to see how the employee’s worth is distributed among these different age groups.
14. What are the various Tableau role-based licenses available?
Role-based licenses provide a range of capabilities at varying prices. Role-based Licenses are available in three different flavors from Tableau.
Viewer: This license allows users to interact with the Tableau server’s workbook by viewing and communicating with it.
This license allows you to use Tableau Desktop.
15. Can Tableau be used to perform load testing? If that’s the case, how would you go about doing so?
Yes, we can utilize TabJolt in Tableau to perform load testing. It’s a server performance testing solution for Tableau. This third-party program is not supported directly by Tableau. As a result, we can install it with other open-source software.
16. What is Tableau forecasting and how does it work? Tableau provides a forecasting mechanism that you can use.
Forecasting is the technique of predicting a measure’s future value (rate, cost, and other numerical estimations). There are several distinct types of data forecasting systems in data analysis. Tableau, on the other hand, only enables forecasting using exponential smoothing.
17. In each of the aforementioned scenarios, which Tableau product should you use?
- For showing the period or duration of any activity.
- For displaying aggregate book sales from January to October
- For presenting quarter-wise revenue growth
18. What is a blended axis, and what is it used for?
Multiple measures are displayed on a single axis, and all markings are displayed in one pane.
Drag a column’s dimension.
In the column, drag the first measure.
In the existing axis, drag the second measure in.
Us/multiple measures blendedaxes.html
19. How does Tableau differ from other standard business intelligence software?
This is another common Tableau interview question. Tableau delivers easy-to-use visual analytic features that are best in class, but it does not assist with plumbing (data foundation). For example, we could combine SQL Server and Tableau to get the full package. If we want to scale Tableau, licenses are relatively pricey.
Traditional business intelligence can manage it all, but it comes with a hefty price tag, including greater consultancy, hardware, and software expenditures. Only Microsoft can offer a reasonable value offering among the mega-vendors. Open-source companies like Pentaho and Jaspersoft now lack a sufficient talent pool.
20. How do Tableau and Palantir compare and contrast?
Palantir and Tableau are two completely different applications. Palantir’s roots are in big data computer science challenges including security, payments, and fraud detection. PayPal, the CIA, and others are among its customers/investors.
Tableau is a visualization software company that has its roots in Stanford University Research. Users can utilize its Visual Query Language (VizQL) to create visualizations on top of typical data warehouses or spreadsheets.
21. Create a map view in which a user may select any state and see the profit and sales in the cities within that state.
We must first have State, City, Sales, and Profit fields in our dataset if we want to present the sales and profit of each city under each state in the same worksheet.
Select the State field with a double-click.
The city should be dragged and dropped into Marks’ card (under the State field)
Drag and drop Sales into Size.
Profit should be dragged and dropped into Color.
Increase the size of the legend by clicking on it (75 percent )
Select Show Quick Filter from the context menu when you right-click on the State field.
Select any state to see if the desired view is available.
22. What is the purpose of Tableau?
This is another often requested question that will help you prepare for your Tableau interview. Tableau’s main purpose is to make data easier to see and understand. Its software tools give common people access to data, allowing a wide range of corporate users to interact with their data, ask questions, solve problems, and generate value.
23. What is Tableau Public, and how does it work?
Tableau Public is a free web-based application that allows anybody to publish interactive data. Anyone can interact with the data, download it, and build their visualizations once it’s on the web. There are no programming skills required. We can also look through the gallery to see what other people have done with it.
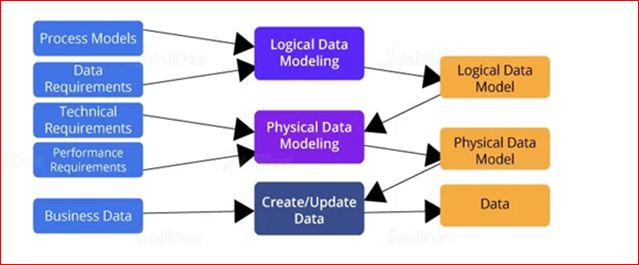
24. What is data modeling and how does it work?
Any of the Tableau interview questions blogs will include this question. Get a sense of what I’m talking about. The examination of data items utilized in a business or other setting, as well as the identification of relationships between these data objects, is known as data modeling. The initial stage in object-oriented programming is data modeling.
25. What is Tableau’s approach to large datasets?
Tableau’s performance is determined by the data source’s performance. Tableau must wait up to that time if the data source takes longer to run a query.
26. How will you publish and schedule a Tableau Server workbook?
Create a schedule at a specific time and then an Extract for the data source before publishing the worksheet to the server.
There is a setting called ‘Scheduling and Authentication’ that we can use before we publish it. Also, make data sources public and give a schedule. This schedule will run for the specified amount of time, and the workbook will be refreshed regularly.
27. Recognize the difference between parameters and filters.
Parameters are dynamic values that can be used in calculations instead of constant values. Parameters can also be used as filters.
Filters, on the other hand, are used to limit the data based on the conditions specified in the Filters shelf.
28. How can I read a SQL that Tableau Desktop has generated?
C: UsersMyDocumentsMy Tableau Repository contains Tableau Desktop Log files. Check the log.txt and tabprotosrv.txt files if we have a live connection to the data source. If we’re going to use Extract, we’ll need to look at the tdeserver.txt file. The tabprotosrv.txt file frequently contains detailed query information.
29. Define the terms Tableau Worksheet, Dashboard, Story, and Workbook.
Tableau, like Microsoft Excel, has a workbook and sheet file structure.
Sheets, which can be worksheets, dashboards, or stories, are contained within a workbook.
A single view, as well as shelves, legends, and the Data pane, are all included in a worksheet.
A dashboard is a graphical representation of numerous worksheet views.
A tale is made up of a series of spreadsheets or dashboards that communicate data.
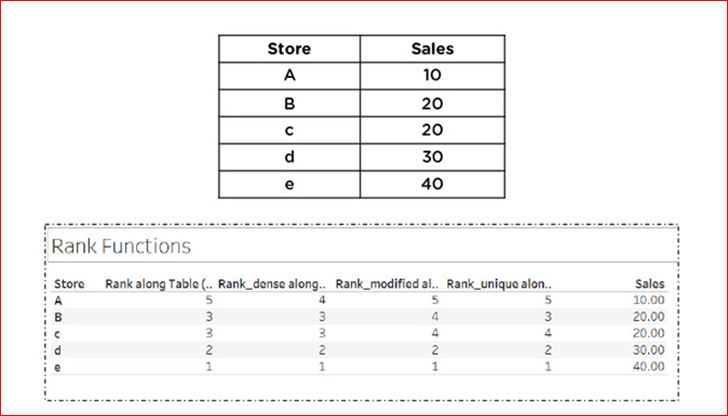
30. What is Tableau’s Rank Function?
A ranking is a method of assigning a position to something, usually within a category and based on a metric. Tableau can rank in a variety of ways, including:
rank dense rank modified rank unique rank unique
Consider the following five stores and their sales:
31. What is Tableau Desktop?
Tableau Desktop is based on breakthrough technology from Stanford University that lets us drag and drop to analyze data. It is a great data visualization tool, with which we can connect to data in a few clicks, then visualize and create interactive dashboards with a few more clicks.
32. How Do You Schedule a Tableau Workbook After It Has Been Published?
Go to Content > data sources or Content > Workbooks, depending on the type of content you wish to refresh, once you’ve signed in to Tableau Server.
Select Actions > Extract Refresh after checking the box for the data source or worksheet you want to refresh.
Select Schedule a Refresh from the Refresh Extracts dialogue and follow the steps:
Choose your preferred schedule.
Specify whether you want a complete or incremental refresh if it’s available.
33. What is the difference between the extensions.twb and. twbx?
A.twb file is an XML document that contains all of your Tableau workbook’s selections and layouts. It is devoid of any information.
A.twbx file is a ‘zipped’ archive that contains a.twb file as well as any other files like extracts and background images.
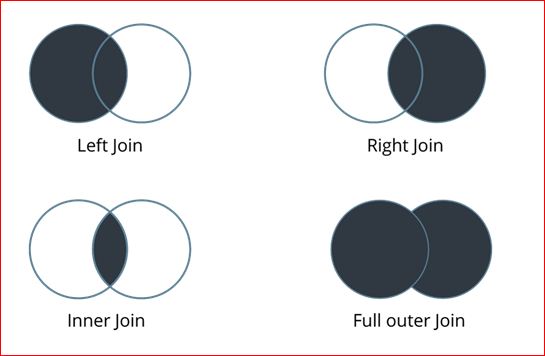
34. What are the different types of joins in Tableau?
The joins in Tableau are the same as SQL joins. Take a look at the diagram below to
35. What exactly are sets?
Sets are unique fields that define a subset of data based on a set of criteria. A set can be based on calculated criteria, such as clients with sales exceeding a given level. As your data changes, computed sets are updated. A set can also be created based on a specific data point in your view.
36. What are the different types of groups?
A group is made up of dimension members who together form higher-level categories. You might wish to put some majors together to form major categories if you’re dealing with a view that provides average test results by major.
37. What are Tableau’s many filters and how do they differ?
Filters are used in Tableau to limit the data that may be retrieved from the database.
Tableau has several different filters: The following filters are available: Quick, Context, and Normal/Traditional.
The Normal Filter is used to restrict data from a database based on a dimension or measure that has been selected. Simply dragging a field onto the ‘Filters’ shelf will create a Traditional Filter.
A quick filter is used to examine the filtering choices and filter each worksheet on a dashboard while dynamically updating the values (within the range defined) throughout the run time.
The Context Filter is used to filter the data that is sent to each worksheet. When a worksheet asks a data source a question, it creates a data source query.
37. In Tableau Server, what are Extracts and Schedules?
The earliest copies or subdivisions of actual data from original data sources are known as data extracts. Because the extracted data is imported into Tableau Engine, workbooks employing data extracts are faster than those using live DB connections. Users can then publish the workbook, which will also publish the extracts in Tableau Server after the data has been extracted. However, unless users set a refresh on the extract, the workbook and extracts will not refresh. Scheduled Refreshes are tasks that are set up to automatically refresh data extracts when a worksheet with data extract is published. This also eliminates the hassle of having to republish the workbook whenever the relevant data changes.
38. In Tableau, how do I see the underlying SQL Queries?
There are two ways to view underlying SQL Queries in Tableau:
Create a Performance Recording to keep track of the important events that occur when you interact with the workbook. Tableau has built a workbook where users may see the performance indicators.
Help -> Performance and Settings -> Begin recording your performance.
Getting Started -> Setting and Performance -> Stop recording your performance.
Examining the Tableau Desktop Logs, which can be found at C:
Users
Documents I Have
My Tableau Repository is a collection of data from Tableau. Check the log.txt and tabprotosrv.txt files for an active connection to the data source. Check the tdeserver.txt file for an extract.
39. What is the best way to perform performance testing in Tableau?
The importance of performance testing in the implementation of tableau cannot be overstated. This can be accomplished by using TabJolt, a “Point and Run” application for testing Tableau Server.
40. How can I get rid of the ‘All’ options in a Tableau auto-filter?
By simply clicking the down arrow in the auto-filter heading, you can remove ‘All’ selections from the auto-filter. You can uncheck the ‘Show “All” Value’ attribute by scrolling down to ‘Customize’ in the menu. It can be turned on by double-checking the field.

41. What is the best way to apply custom color to Tableau?
Adding a Custom Color is a powerful Tableau option. Once you’ve saved the. tps file, restart Tableau. Drag the one you want to color to Color from the Measures pane. Select Edit Colors from the color legend menu arrow. Select the palette drop-down list from the dialogue box that appears and edit as needed.
42. What exactly is TDE?
TDE is a Tableau desktop file that contains a .tde extension. It refers to the file that contains data extracted from external sources like MS Excel, MS Access, or CSV files.
There are two aspects of TDE design that make them ideal for supporting analytics and data discovery.
- Firstly, TDE is a columnar store.
- The second is how they are structured which impacts how they are loaded into memory and used by Tableau. This is an important aspect of how TDEs are “architecture aware”. Architecture-awareness means that TDEs use all parts of your computer memory, from RAM to hard disk, and put each part to work which best fits its characteristics.
43. How can reports be automated?
You must publish the report to the tableau server, and there is one option to schedule reports during publishing.
All you have to do now is choose when you want the data to be refreshed.
44. What does it mean when you say “assume referential integrity”?
In some circumstances, selecting Assume Referential Integrity from the Data menu can help increase query performance. Tableau will only include the connected table in the query if it is directly referenced by fields in the view when you select this option.
45. In Tableau, when would you use Joins vs. Blending?
Joins are always preferred when data is contained in a single source. Blending is the most viable option when your data isn’t all in one place.
46. What is a Data Blending Join by default?
Data blending refers to the ability to combine data from numerous sources into a single Tableau view without requiring any specific code. A left outer join is comparable to a default blend. It is possible to imitate left, right, and inner join by switching which data source is main or by filtering nulls.
47. What does a mixed axis mean to you?
Measures in Tableau can share a single axis, allowing all of the marks to be displayed in a single pane. When you blend measurements, instead of adding rows and columns to the view, you get a single row or column with all of the values for each measure displayed on a single continuous axis.
48. How does the DRIVE program work?
Tableau Drive is an approach for deploying self-service analytics at a large scale. Drive is based on corporate deployment best practices. Iterative, agile procedures are used in the methodology, which is faster and more successful than typical long-cycle deployments.
A new kind of business-IT partnership is at the heart of this strategy.
49. How do I utilize a calculated field with a group?
By including the same calculation in the SQL query group By’ clause, or by establishing a Calculated Field in the Data Window and utilizing it whenever you want to group the fields.
In a calculation, groups are used. In a calculation, you can’t use ad-hoc groupings as a reference.
Using groups generated in the secondary data source, blend the data: Only computed groups are considered.
50. Describe the various Tableau files.
Tableau files include the following:
Workbooks are collections of worksheets and dashboards.
Bookmarks: It comes with a single worksheet and is a simple method to share your work with others.
Workbooks that are packaged include a workbook as well as any supporting local file data and background pictures.
Extract files are a local copy of a subset or the entirety of a data source.
Data Connection Files: This is a tiny XML file that contains various connection details.